yum源新增
sudo rpm --import https://packages.elastic.co/GPG-KEY-elasticsearch
vim /etc/yum.repos.d/elasticsearch.repo
[elastic-7.x]
name=Elastic repository for 7.x packages
baseurl=https://artifacts.elastic.co/packages/7.x/yum
gpgcheck=1
gpgkey=https://artifacts.elastic.co/GPG-KEY-elasticsearch
enabled=1
autorefresh=1
type=rpm-md
安裝及設定開機啟動
sudo yum install metricbeat
sudo systemctl enable metricbeat
編譯設定檔
vi /etc/metricbeat/metricbeat.yml
metricbeat.config.modules:
  path: ${path.config}/modules.d/*.yml
  reload.enabled: false
setup.template.settings:
  index.number_of_shards: 1
  index.codec: best_compression
setup.kibana:
  host: "192.168.0.204:5601"
output.elasticsearch:
  hosts: ["192.168.0.204:9200"]
  #username: "elastic"
  #password: "yourkibanapassword"
vi /etc/metricbeat/modules.d/system.yml
# Module: system
# Docs: https://www.elastic.co/guide/en/beats/metricbeat/7.4/metricbeat-module-system.html

- module: system
  period: 10s
  metricsets:
    - cpu
    - load
    - memory
    - network
    - process
    - process_summary
    - socket_summary
    #- entropy
    #- core
    #- diskio
    #- socket
  process.include_top_n:
    by_cpu: 5      # include top 5 processes by CPU
    by_memory: 5   # include top 5 processes by memory

- module: system
  period: 1m
  metricsets:
    - filesystem
    - fsstat
  processors:
  - drop_event.when.regexp:
      system.filesystem.mount_point: '^/(sys|cgroup|proc|dev|etc|host|lib)($|/)'

- module: system
  period: 15m
  metricsets:
    - uptime

#- module: system
#  period: 5m
#  metricsets:
#    - raid
#  raid.mount_point: '/'
啟動服務
sudo systemctl start metricbeat
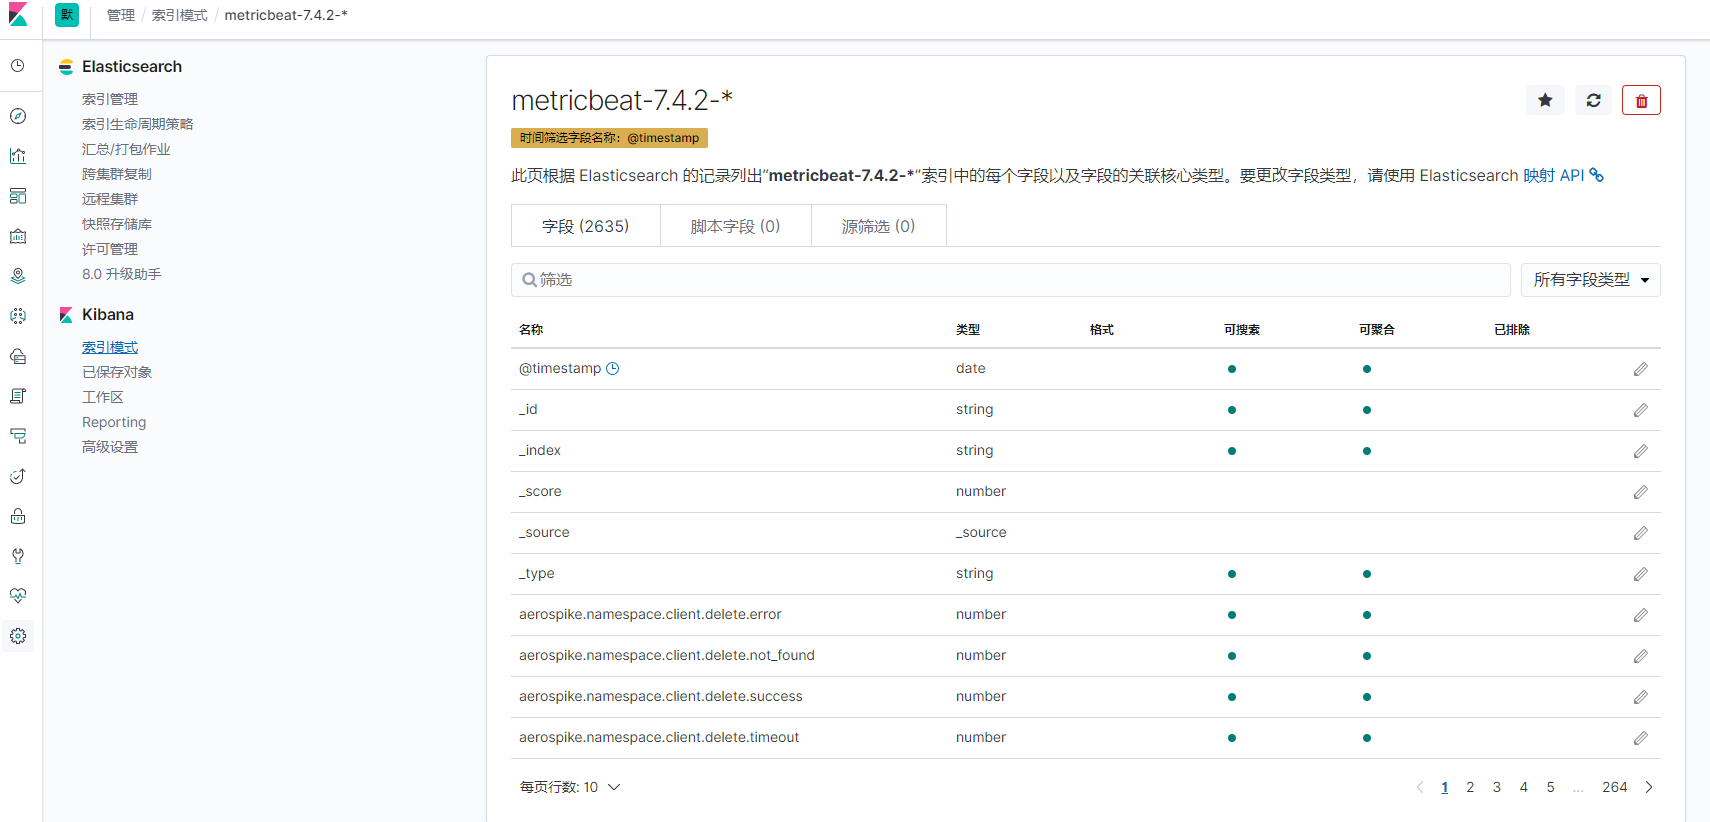
到kibana上設定索引
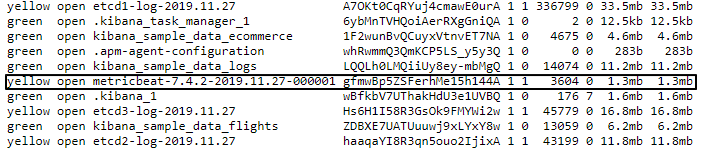
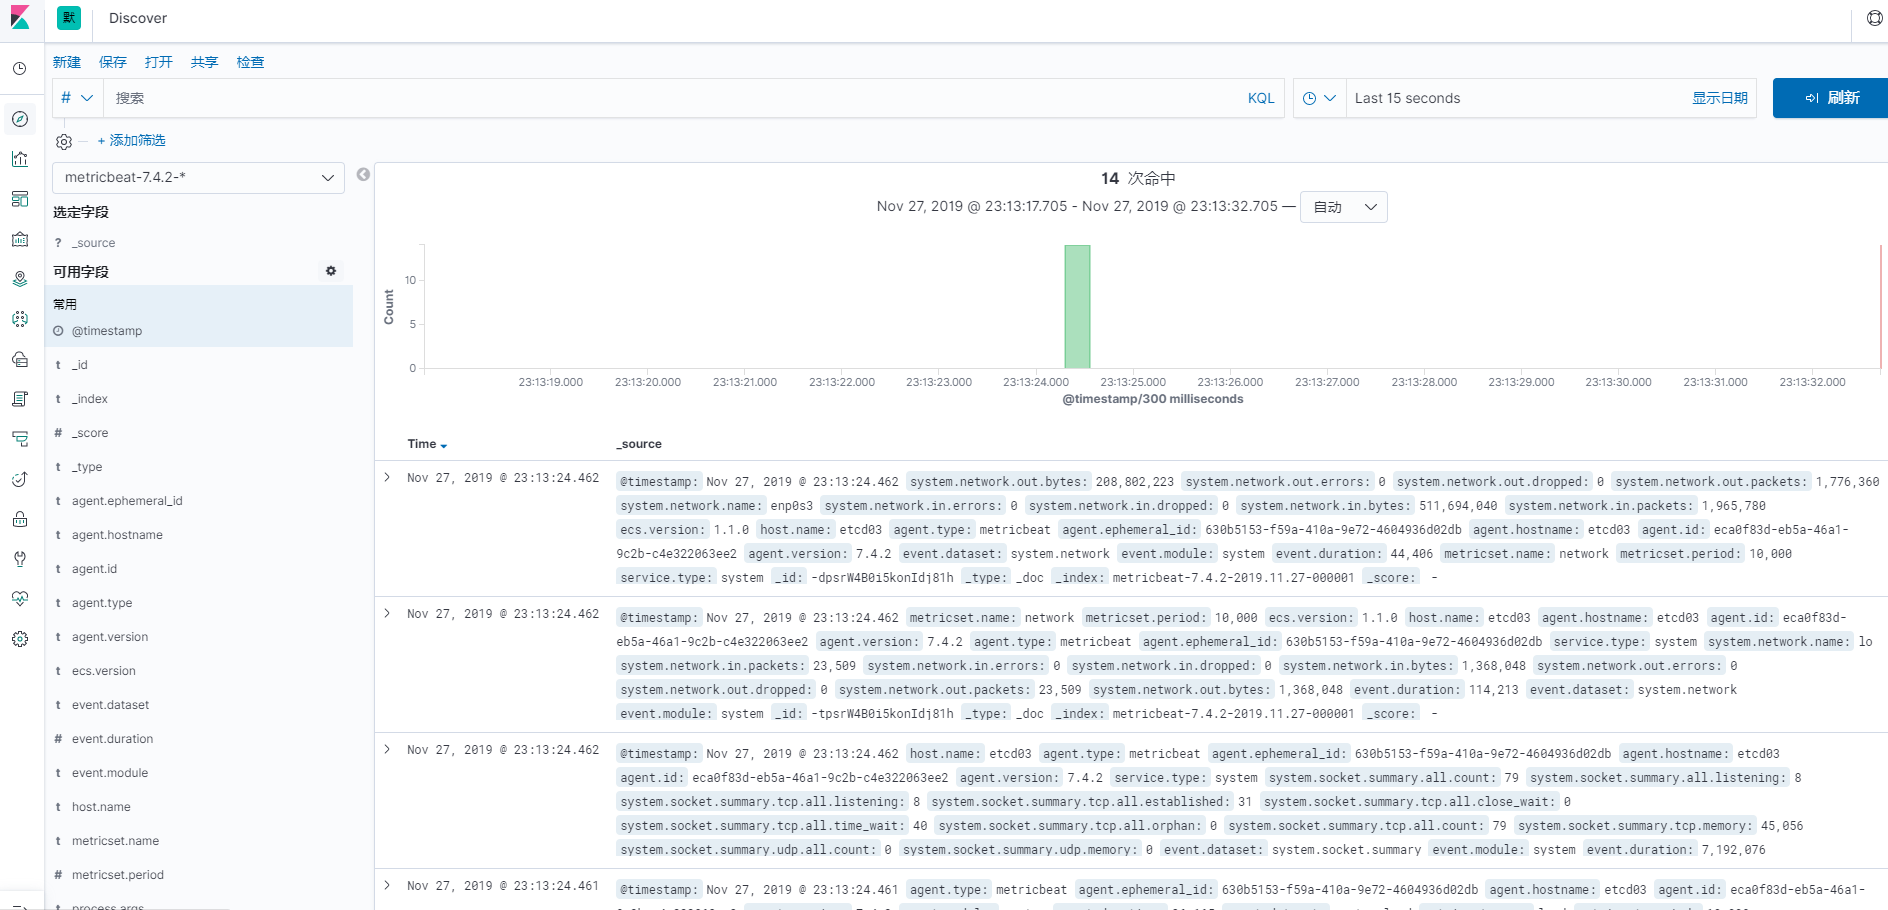
查詢資料是否正常
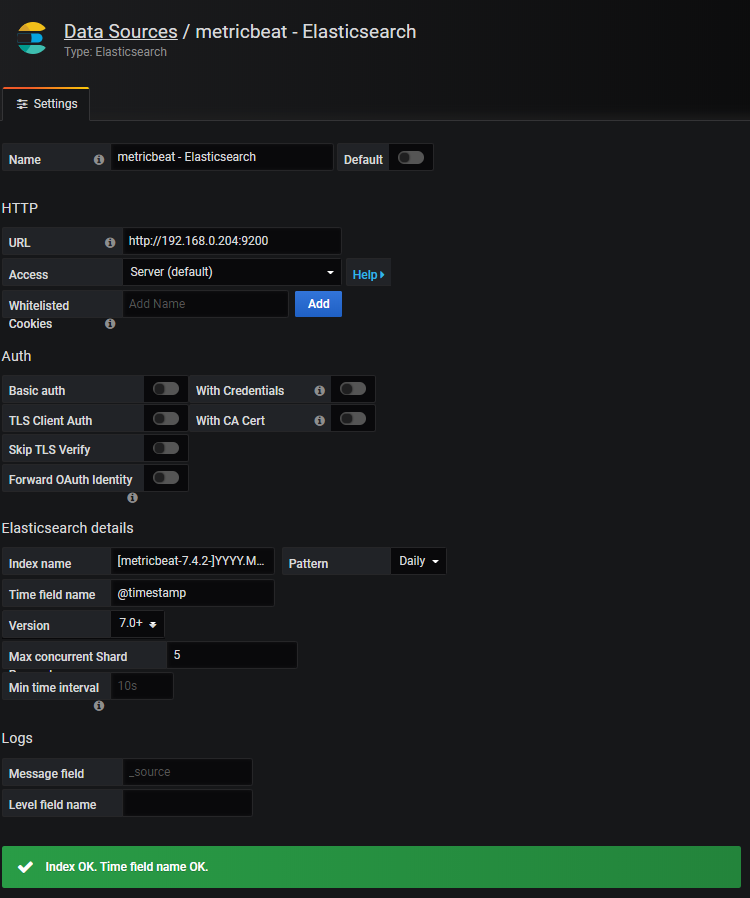
grafana新增ES的datasource
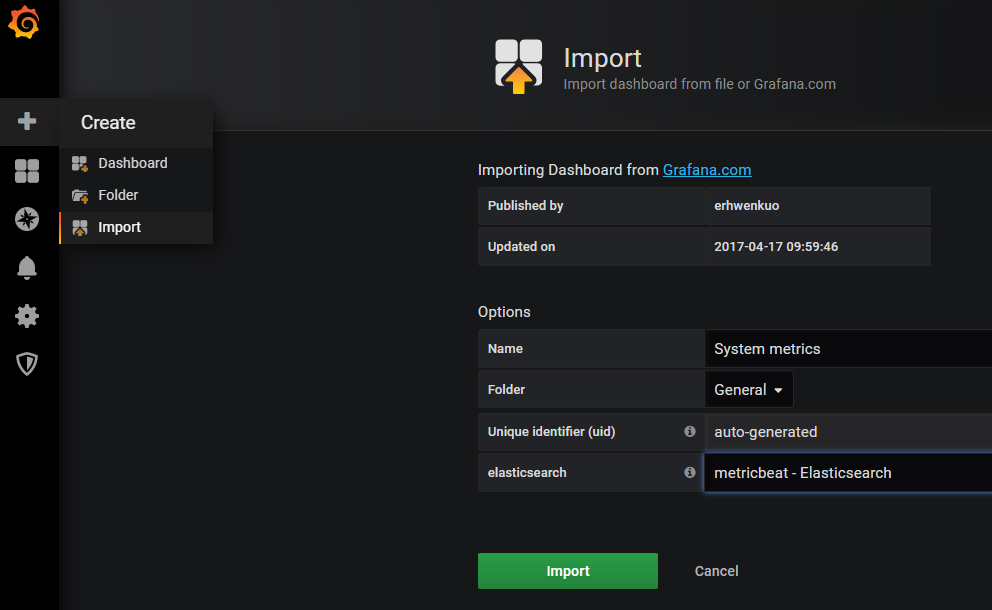
新增metricbeat模版 資料來源選剛才建好的source
https://grafana.com/grafana/dashboards/2030
參考網頁
https://www.itread01.com/content/1532958197.html
https://www.elastic.co/guide/en/beats/metricbeat/current/exported-fields-system.html