1.安裝kube-prometheus-stack
$ helm repo add prometheus-community https://prometheus-community.github.io/helm-charts
$ helm repo update
創建要配置的 vlaues 檔案: kube-stack-prometheus-values.yaml
grafana:
  ingress:
    ## If true, Grafana Ingress will be created
    enabled: true
    hosts:
      - grafana.example.it
  # change timezone setting base on browser
  defaultDashboardsTimezone: browser
  grafana.ini:
    users:
      viewers_can_edit: true
    auth:
      disable_login_form: false
      disable_signout_menu: false
    auth.anonymous:
      enabled: true
      org_role: Viewer
  sidecar:
    datasources:
      logLevel: "DEBUG"
      enabled: true
      searchNamespace: "ALL"
    dashboards:
      logLevel: "DEBUG"
      # enable the cluster wide search for dashbaords and adds/updates/deletes them in grafana
      enabled: true
      searchNamespace: "ALL"
      label: grafana_dashboard
      labelValue: "1"

prometheus:
  ingress:
    ## If true, Grafana Ingress will be created
    enabled: true
    hosts:
      - prometheus.example.it
  prometheusSpec:
    # enable the cluster wide search for ServiceMonitor CRD
    serviceMonitorSelectorNilUsesHelmValues: false
    # enable the cluster wide search for PodMonitor CRD
    podMonitorSelectorNilUsesHelmValues: false
    # enable the cluster wide search for PrometheusRule CRD
    ruleSelectorNilUsesHelmValues: false
    probeSelectorNilUsesHelmValues: false

alertmanager:
  ingress:
    ## If true, Grafana Ingress will be created
    enabled: true
    hosts:
      - alertmanager.example.it
安裝
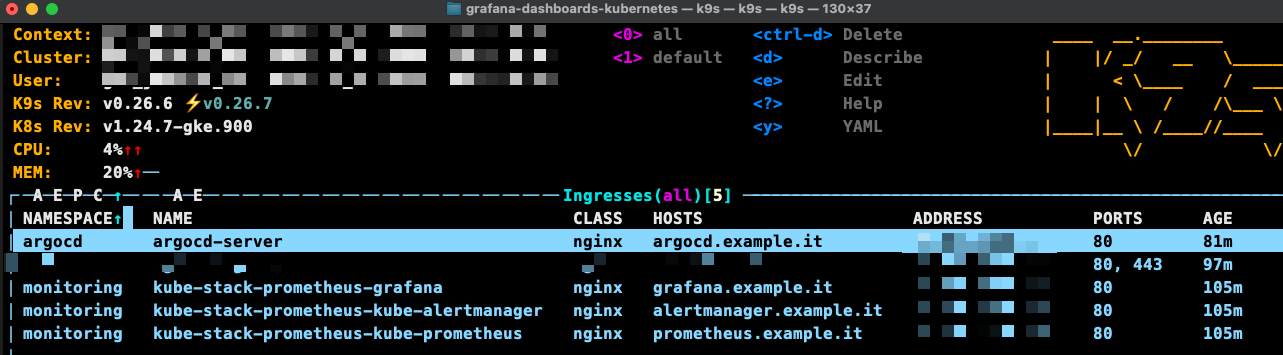
$ helm upgrade --install --wait --create-namespace --namespace monitoring \
kube-stack-prometheus prometheus-community/kube-prometheus-stack \
--values kube-stack-prometheus-values.yaml
$ kubectl get ing -n monitoring
查看已建立好的ingress入口 直接綁hosts開啟ui
35.x.x.x grafana.example.it
35.x.x.x alertmanager.example.it
35.x.x.x prometheus.example.it
35.x.x.x argocd.example.it
grafana預設帳密
username: admin
password: prom-operator
加入模版
git clone https://github.com/dotdc/grafana-dashboards-kubernetes.git
cd grafana-dashboards-kubernetes
kubectl apply -f argocd-app.yml
2.佈署ArgoCD
helm repo add argo https://argoproj.github.io/argo-helm
helm repo update
創建要配置的 vlaues 檔案: argocd-values.yaml
## Argo CD server
server:
  extraArgs:
  # -- Run server without TLS
  - --insecure
  ingress:
    # -- Enable an ingress resource for the Argo CD server
    enabled: true
    # -- List of ingress hosts
    ## Argo Ingress.
    ## Hostnames must be provided if Ingress is enabled.
    ## Secrets must be manually created in the namespace
    hosts:
      - argocd.example.it
  metrics:
    # -- Deploy metrics service
    enabled: true
    service:
      # -- Metrics service port
      servicePort: 8083
      # -- Metrics service port name
      portName: http-metrics
    serviceMonitor:
      # -- Enable a prometheus ServiceMonitor
      enabled: true

## Repo Server
repoServer:
  ## Repo server metrics service configuration
  metrics:
    # -- Deploy metrics service
    enabled: true
    service:
      # -- Metrics service port
      servicePort: 8084
      # -- Metrics service port name
      portName: http-metrics
    serviceMonitor:
      # -- Enable a prometheus ServiceMonitor
      enabled: true

## Application controller
controller:
  ## Application controller metrics configuration
  metrics:
    # -- Deploy metrics service
    enabled: true
    applicationLabels:
      # -- Enables additional labels in argocd_app_labels metric
      enabled: true
    service:
      # -- Metrics service port
      servicePort: 8082
      # -- Metrics service port name
      portName: http-metrics
    serviceMonitor:
      # -- Enable a prometheus ServiceMonitor
      enabled: true
    rules:
      # -- Deploy a PrometheusRule for the application controller
      enabled: true
      # -- PrometheusRule.Spec for the application controller
      spec:
       - alert: ArgoAppMissing
         expr: |
           absent(argocd_app_info) == 1
         for: 15m
         labels:
           severity: critical
         annotations:
           summary: "[Argo CD] No reported applications"
           description: >
             Argo CD has not reported any applications data for the past 15 minutes which
             means that it must be down or not functioning properly.  This needs to be
             resolved for this cloud to continue to maintain state.
       - alert: ArgoAppNotSynced
         expr: |
           argocd_app_info{sync_status!="Synced"} == 1
         for: 12h
         labels:
           severity: warning
         annotations:
           summary: "[{{`{{$labels.name}}`}}] Application not synchronized"
           description: >
             The application [{{`{{$labels.name}}`}} has not been synchronized for over
             12 hours which means that the state of this cloud has drifted away from the
             state inside Git.
      selector:
        prometheus: kube-prometheus
      namespace: monitoring

## ApplicationSet controller
applicationSet:
  ## Metrics service configuration
  metrics:
    # -- Deploy metrics service
    enabled: true
    service:
      # -- Metrics service port
      servicePort: 8085
      # -- Metrics service port name
      portName: http-metrics
    serviceMonitor:
      # -- Enable a prometheus ServiceMonitor
      enabled: true
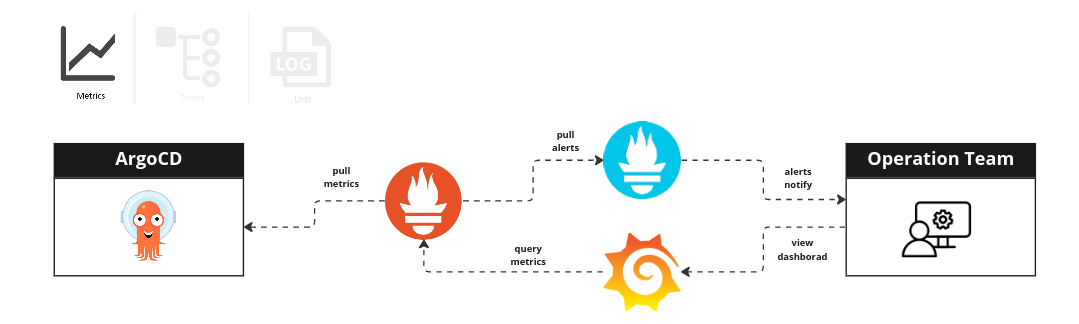
上述的 Helm 配置檔案包含了與 Prometheus operation 整合的許多配置,主要包含了:
- 創建相關的 Service 來曝露在 ArgoCD 關鍵元件 metric 端點的 port
- 創建 ServiceMonitor(CRD) 來讓 Prometheus 感知如何刮取指標
- 創建 PrometheusRule(CRD) 來設定 AlertRule 來對 ArgoCD 告警
使用 Helm 在 argocd 的命名空間中部署 argo/argo-cd chart:
helm upgrade --install --create-namespace --namespace argocd  \
     argocd argo/argo-cd \
     --values argocd-values.yaml

kubectl get ing -n argocd
使用下列的命令來取得 argocd 初始化的密碼:
這個密碼是 ArgoCD 在安裝時動態生成, 每次都會不同。
kubectl -n argocd get secret argocd-initial-admin-secret -o jsonpath="{.data.password}" | base64 -d
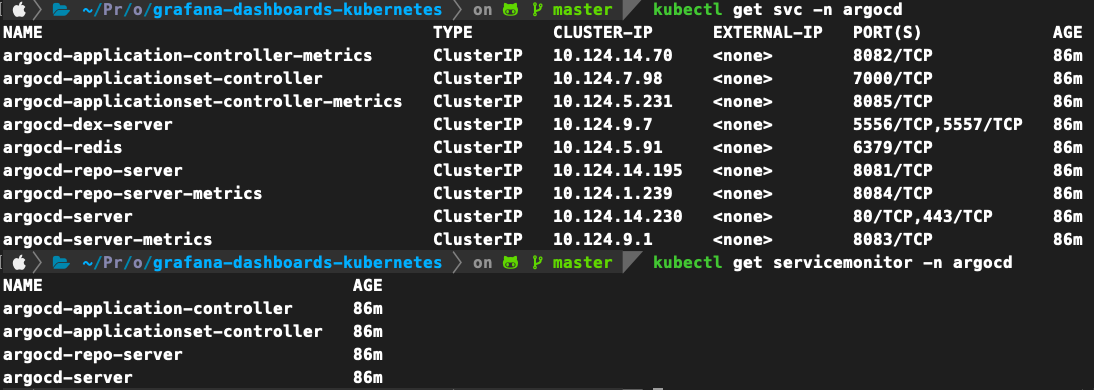
通過 Helm 的設定, 在環境裡己經有相關的 ServiceMonitor 物件。
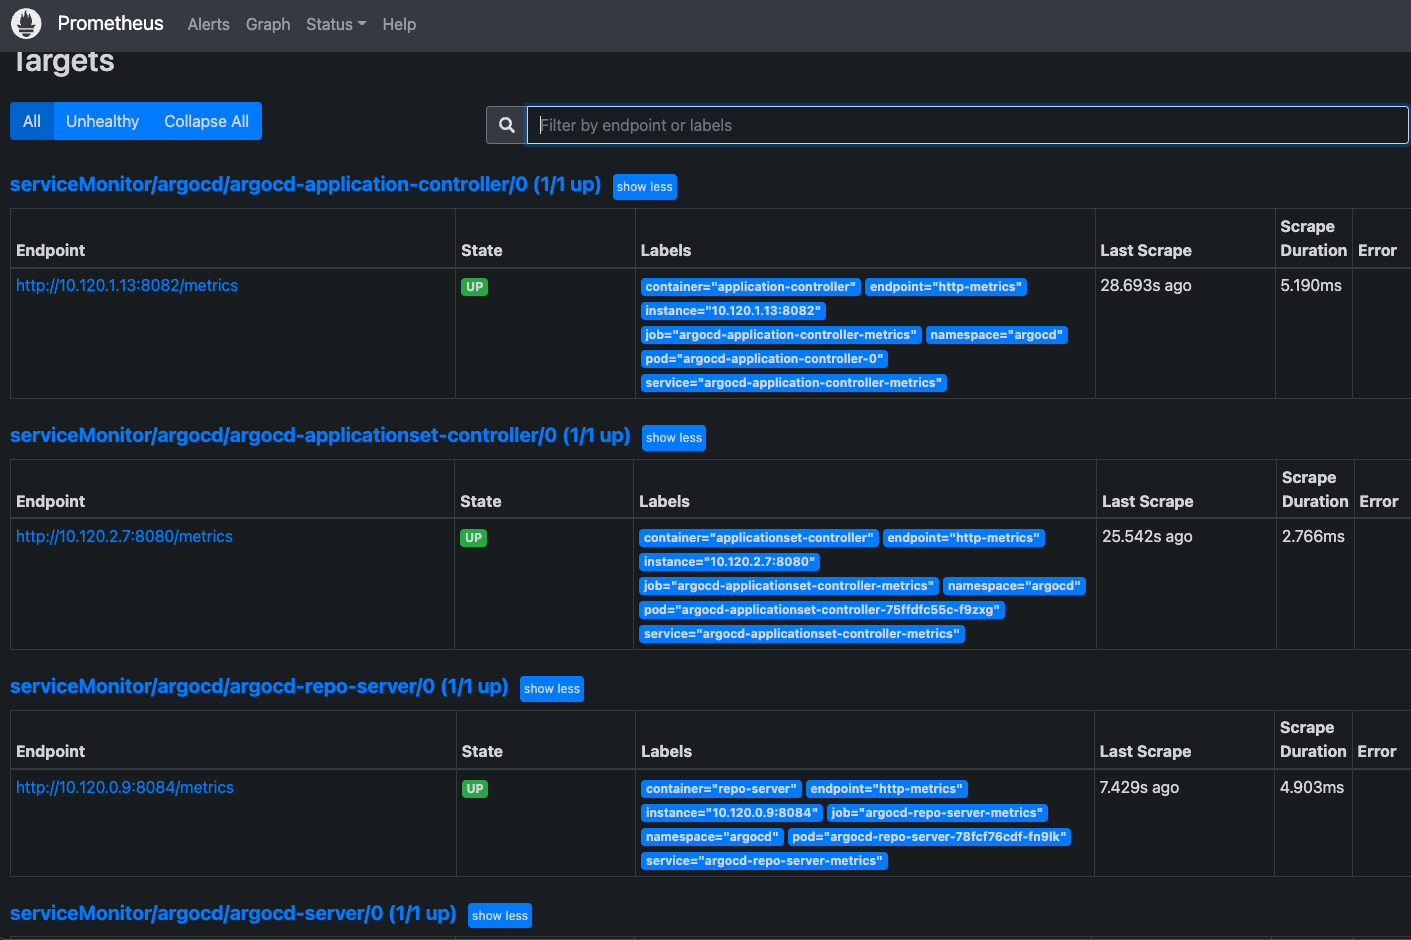
在 Prometheus UI 中點選 Status >> Target:
設定應用程序告警規則
Prometheus 除了可以收集應用程式指標,同時它也是用來執行告警規則的元件。prometheus-operator 的 CRD 中 PrometheusRule 就是讓各應用程式的開發團隊可以使用這個 CRD 來自服務式地配置讓 Prometheus 執行的告警規則。
PrometheusRule.yaml
apiVersion: monitoring.coreos.com/v1
kind: PrometheusRule
metadata:
  name: argocd-application-controller
  namespace: monitoring
spec:
  groups:
  - name: argocd
    partial_response_strategy: ""
    rules:
    - alert: ArgoAppMissing
      annotations:
        description: |
          Argo CD has not reported any applications data for the past 15 minutes which means that it must be down or not functioning properly.  This needs to be resolved for this cloud to continue to maintain state.
        summary: '[Argo CD] No reported applications'
      expr: |
        absent(argocd_app_info) == 1
      for: 15m
      labels:
        severity: critical
    - alert: ArgoAppNotSynced
      annotations:
        description: |
          The application [{{`{{$labels.name}}`}} has not been synchronized for over 12 hours which means that the state of this cloud has drifted away from the state inside Git.
        summary: '[{{`{{$labels.name}}`}}] Application not synchronized'
      expr: |
        argocd_app_info{sync_status!="Synced"} == 1
      for: 12h
      labels:
        severity: warning
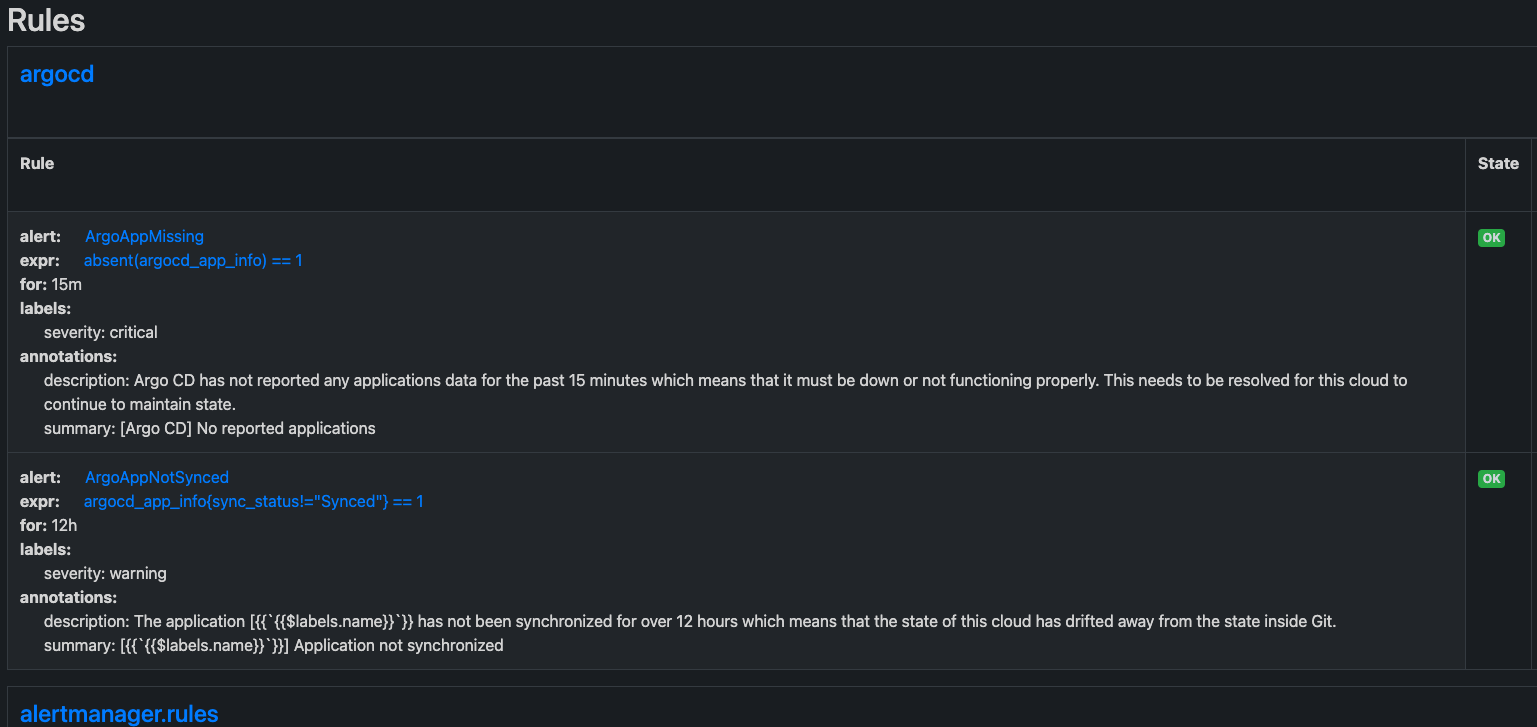
在 Prometheus UI 中點選 Status >> Rules:
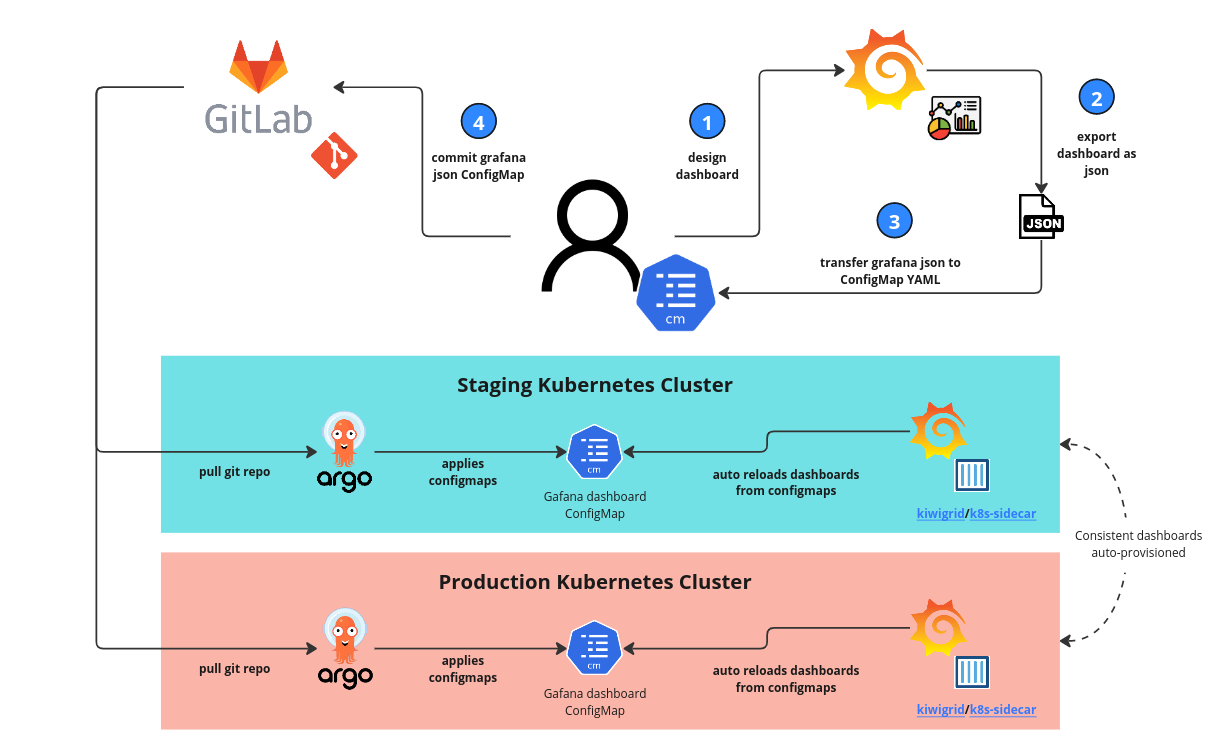
Dashboards, ConfigMaps 與 GitOps
幸運的是,Grafana 5.0 版引入了一個使用配置文件的新的主動供應系統。這意味著我們現在能夠從配置文件(Kubernetes 中的 ConfigMap)配置儀表板。 Grafana 將自動加載它們,而無需進一步部署部署(就像我們過去在 Kubernetes 中使用配置映射時一樣)。
我們現在需要找到一種方法將 configmap 從一個地方分發到所有環境。GitOps 方法可以幫助我們實現這一點,因為我們將儀表板配置存儲在 git 中,合併到主分支的任何更改都將自動應用於我們的系統。
市面上有很多 GitOps 工具,比如 Flux、Jenkins 等等——我們選擇了 ArgoCD。ArgoCD 是用於 Kubernetes 的聲明式 GitOps 持續交付工具。
ArgoCD 持續監視指定的 git 存儲庫,將其與集群中當前部署的清單進行比較,並在它們上有效地運行 kubectl apply -f <all>。
對於廣泛的用例,這導致了一個非常簡單和可見的持續交付過程——在我們的例子中,在 configmaps 中持續部署 Grafana 儀表板。
下載dashbaord
wget https://raw.githubusercontent.com/argoproj/argo-cd/master/examples/dashboard.json
創建包含 Dashboard 的 ConfigMap:
kubectl create configmap cm-argocd-dashboard \
--from-file=dashboard.json \
--dry-run=client -o yaml > cm-argocd-dashboard.yaml
設定 Dashboard Aware Flag:
使用任一文件編輯器來編修 cm-argocd-dashboard.yaml 來增加一個關鍵的標籤 grafana_dashboard: "1":
apply ConfigMap 到 Kubernetes:
執行下列指令來手動將 cm-argocd-dashboard.yaml 建置進 Kubernetes 中:
kubectl apply -f cm-argocd-dashboard.yaml
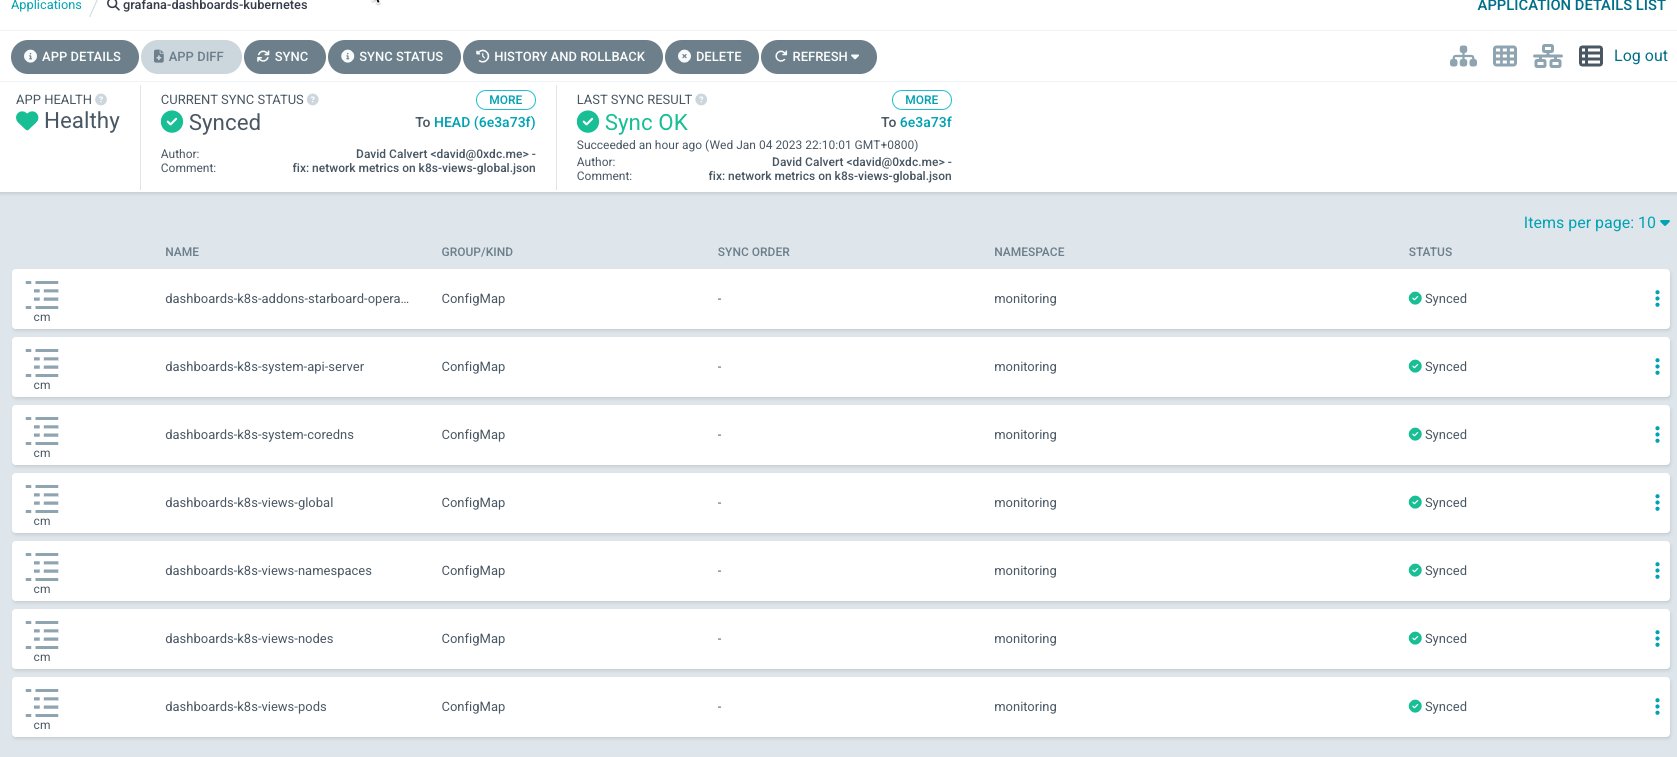
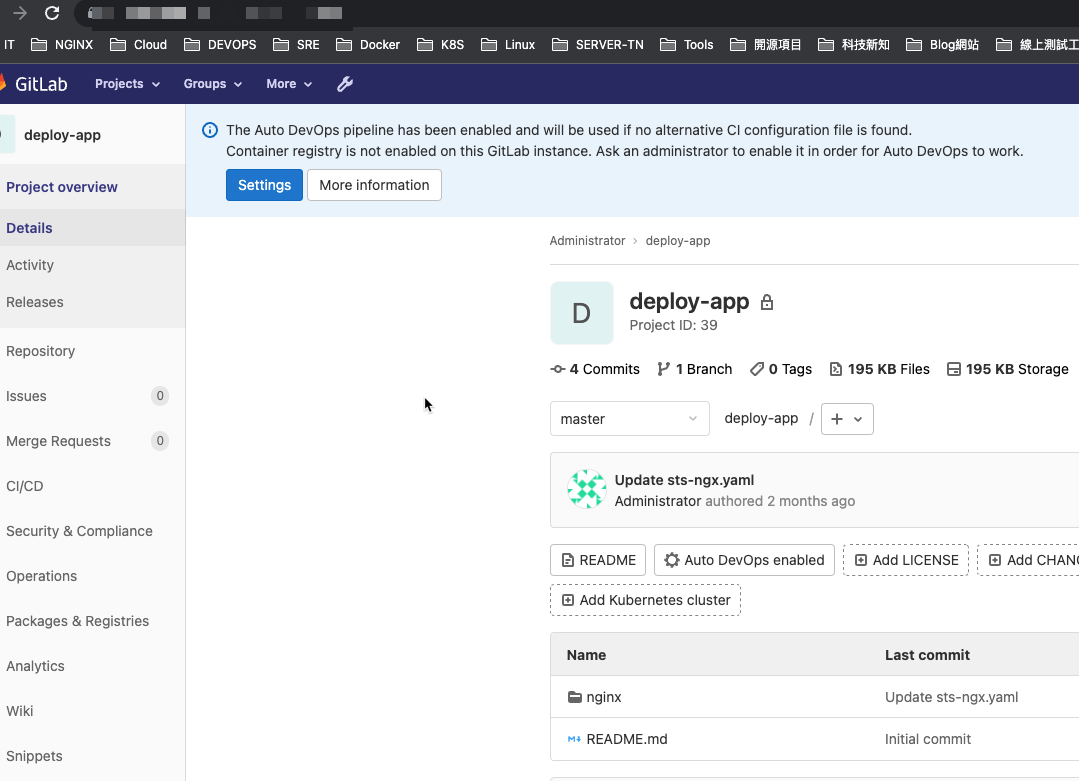
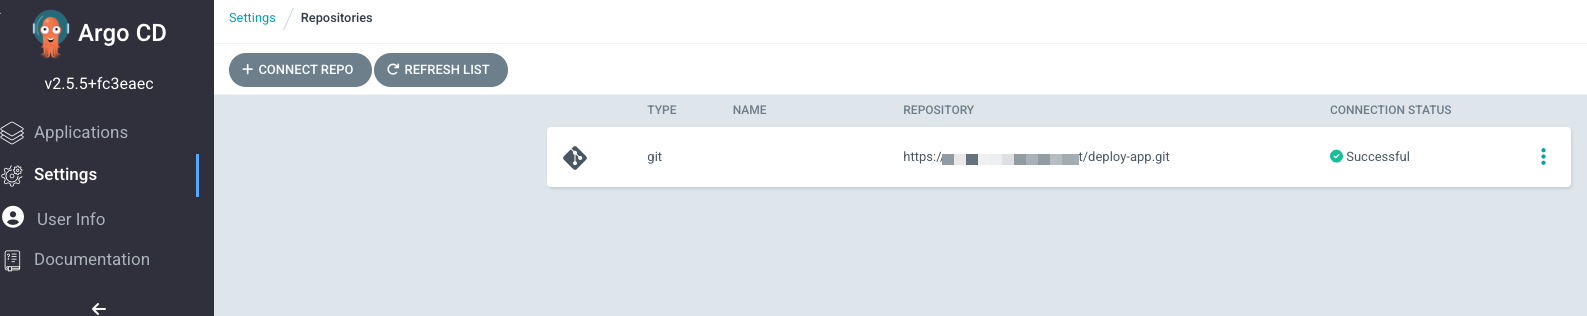
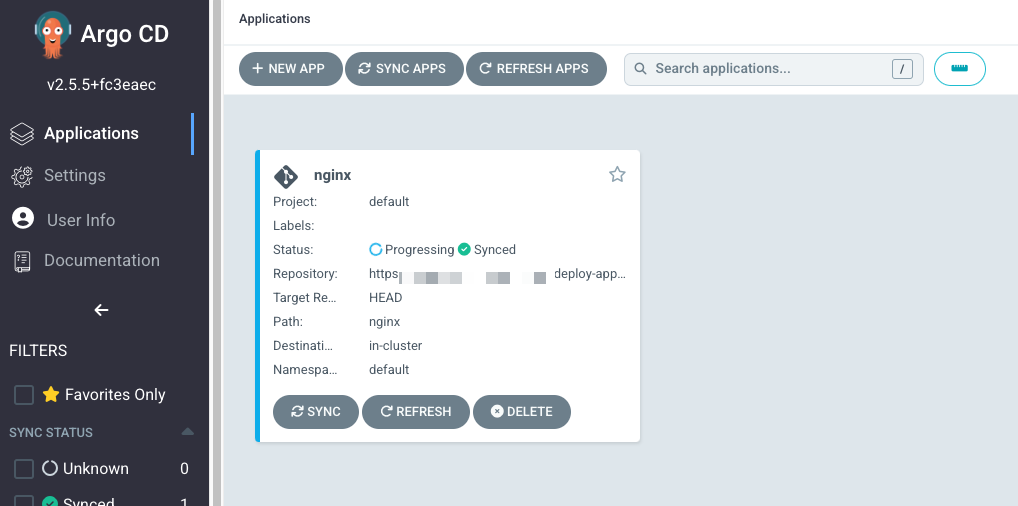
3.從 Git 存儲庫佈署應用程序
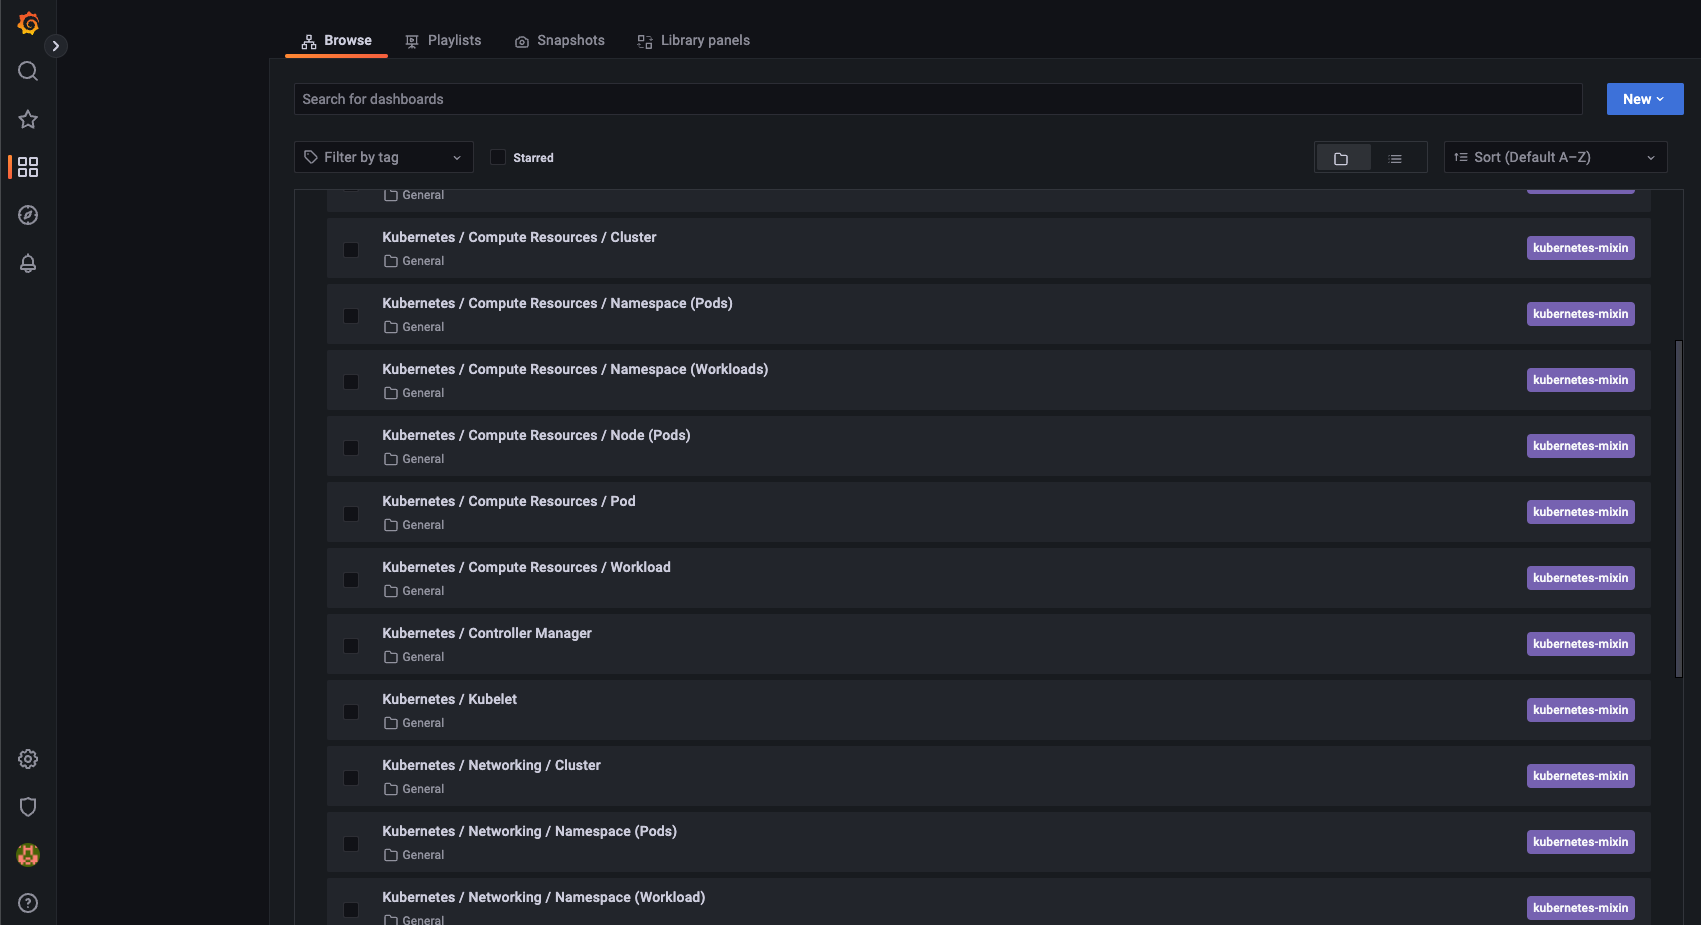
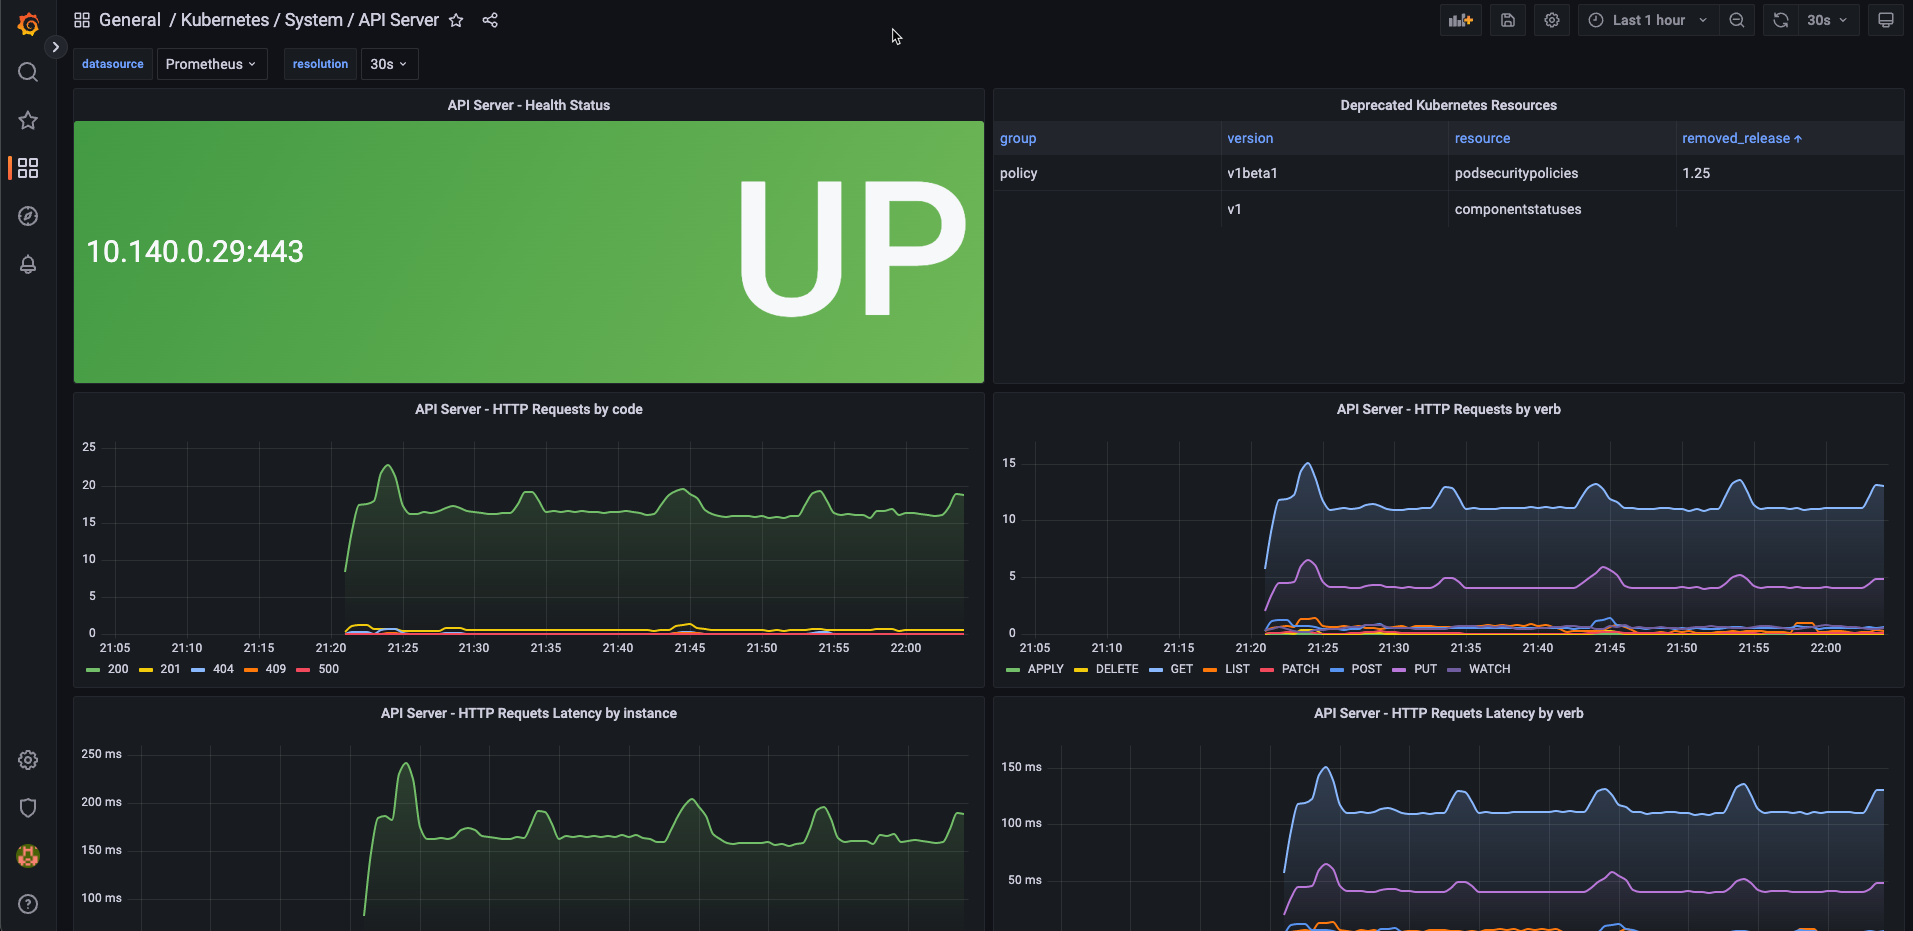
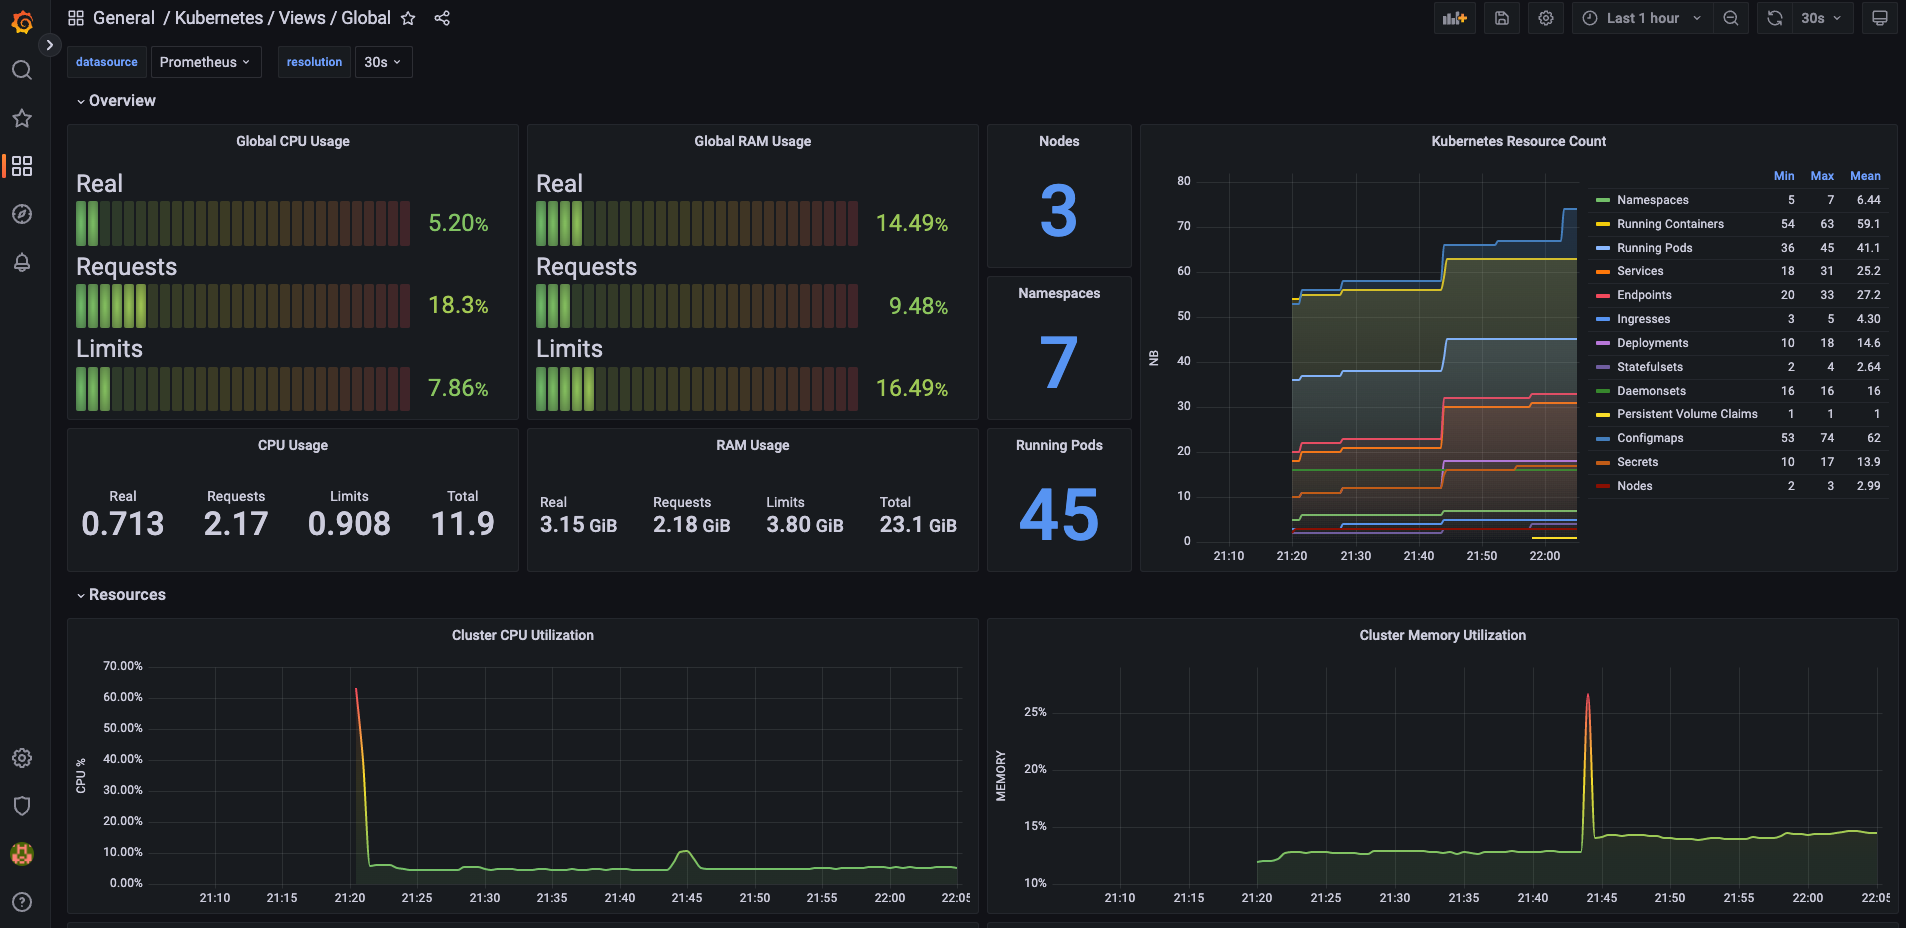
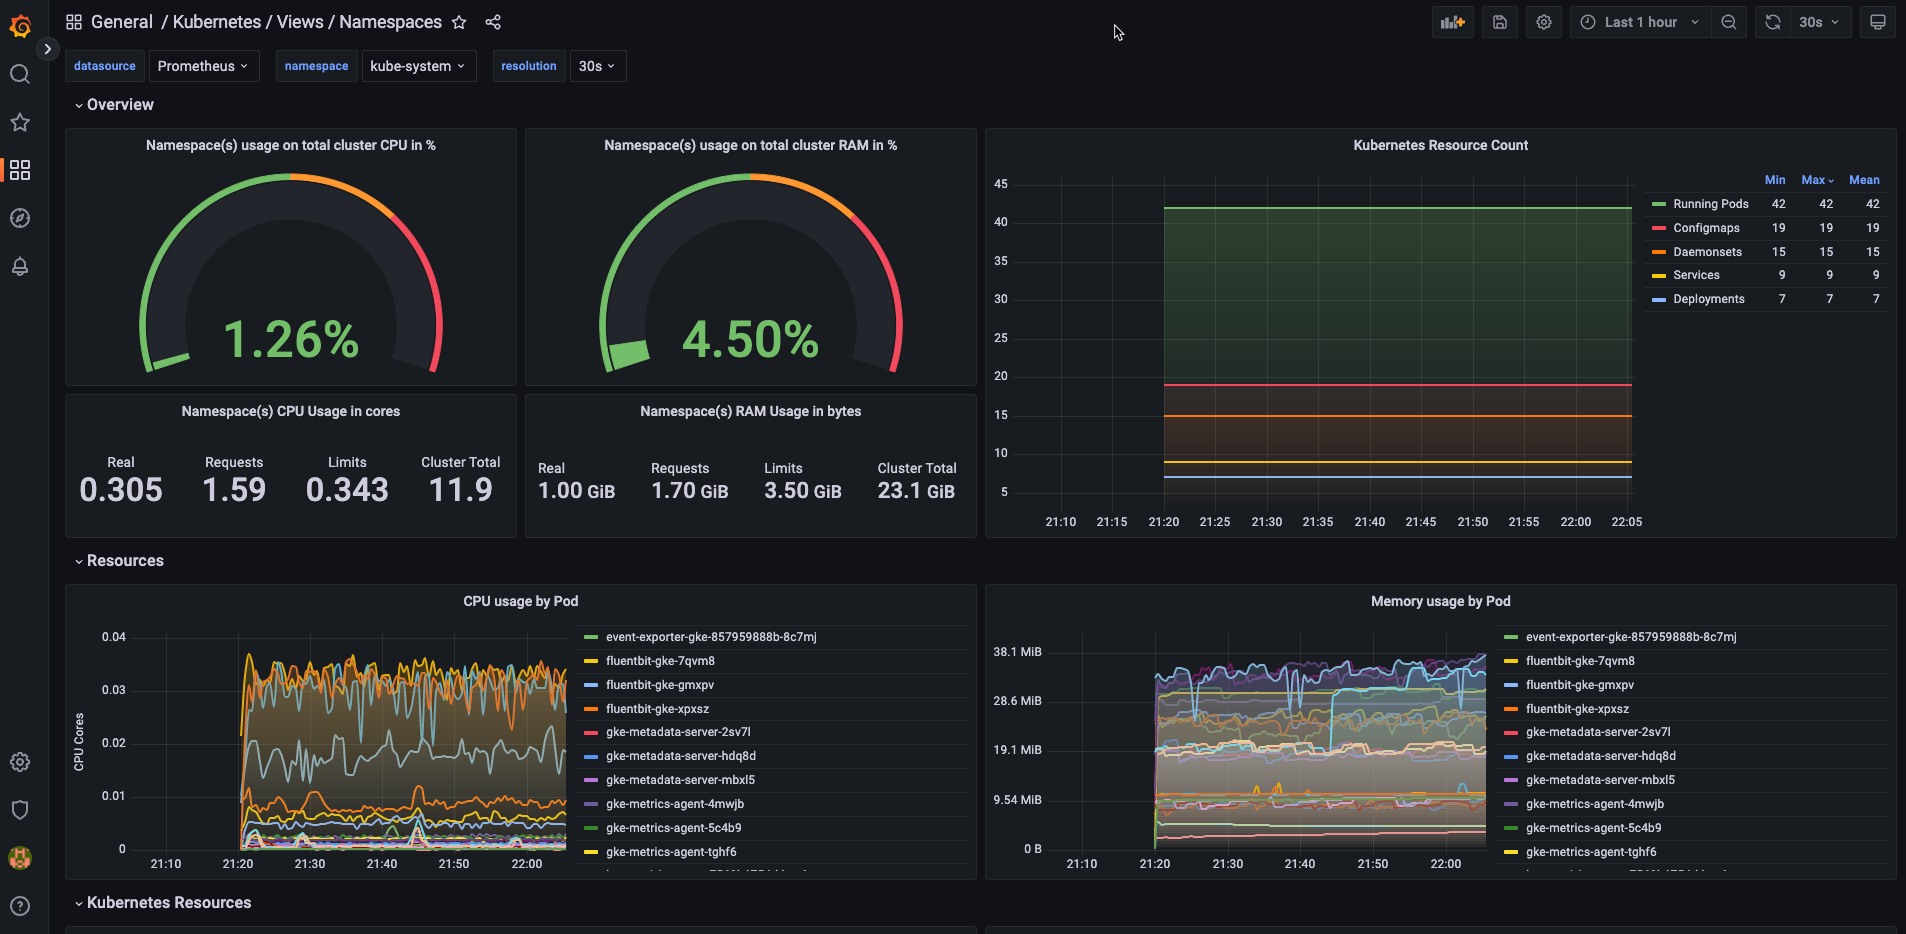
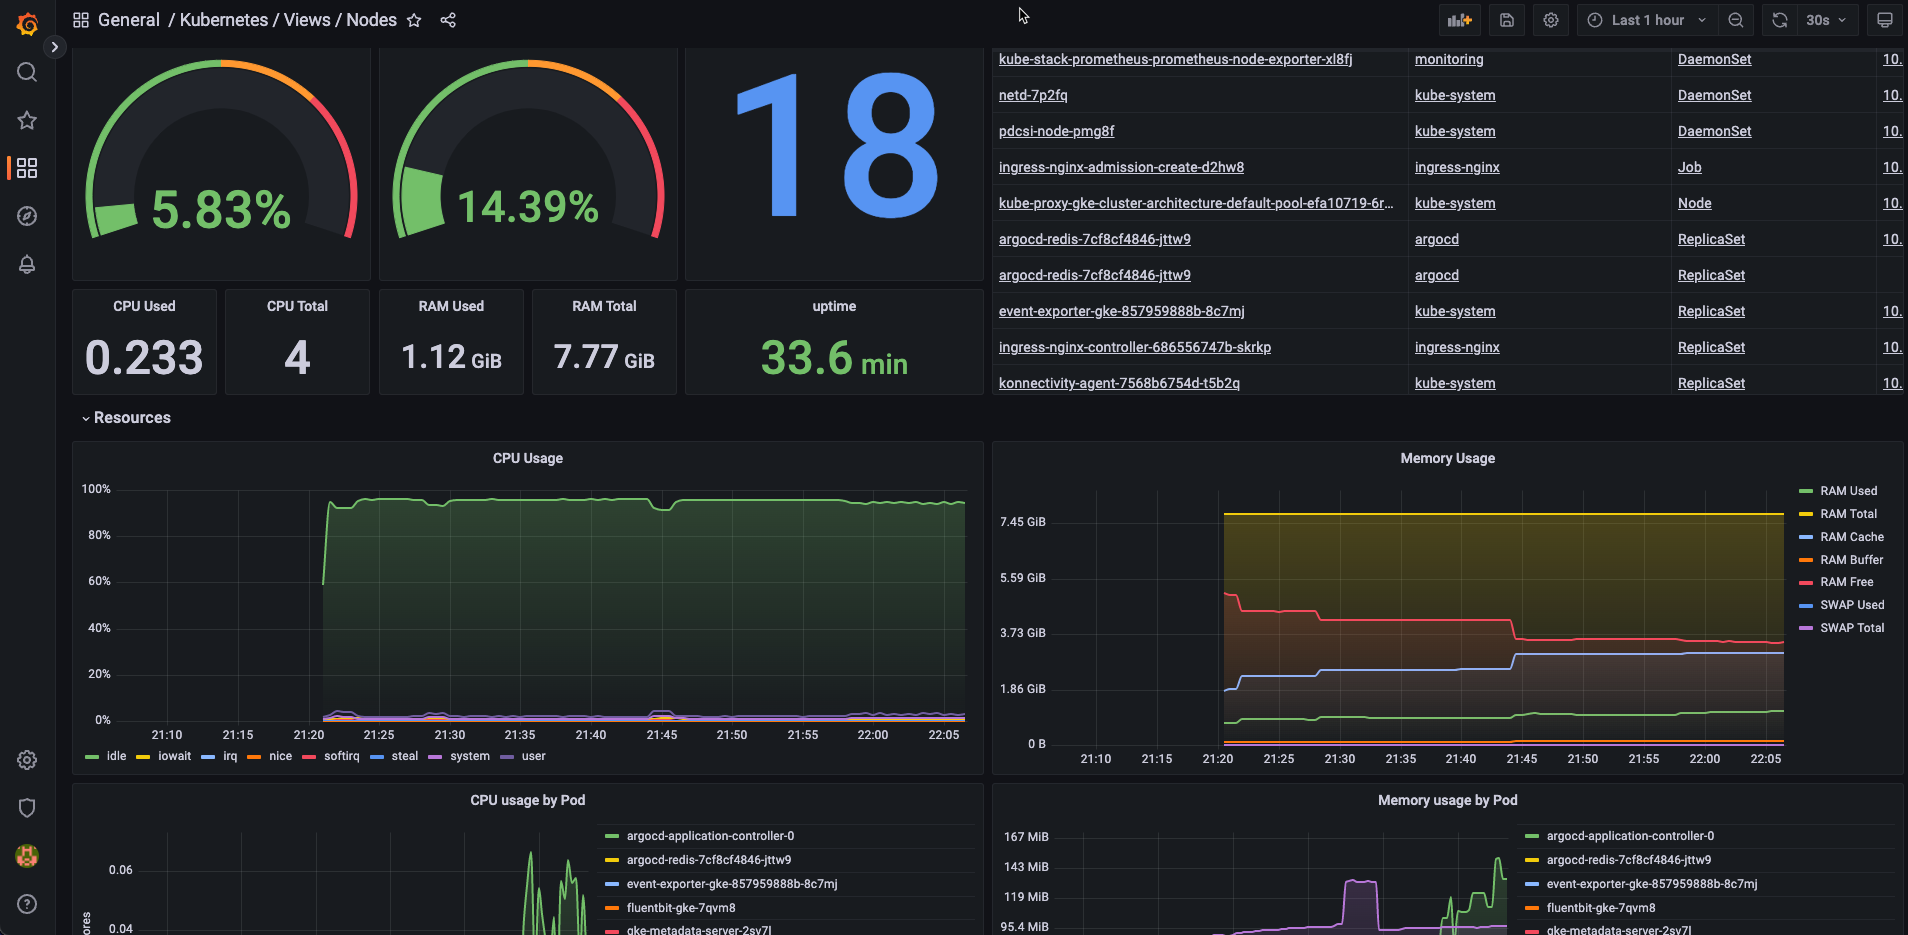
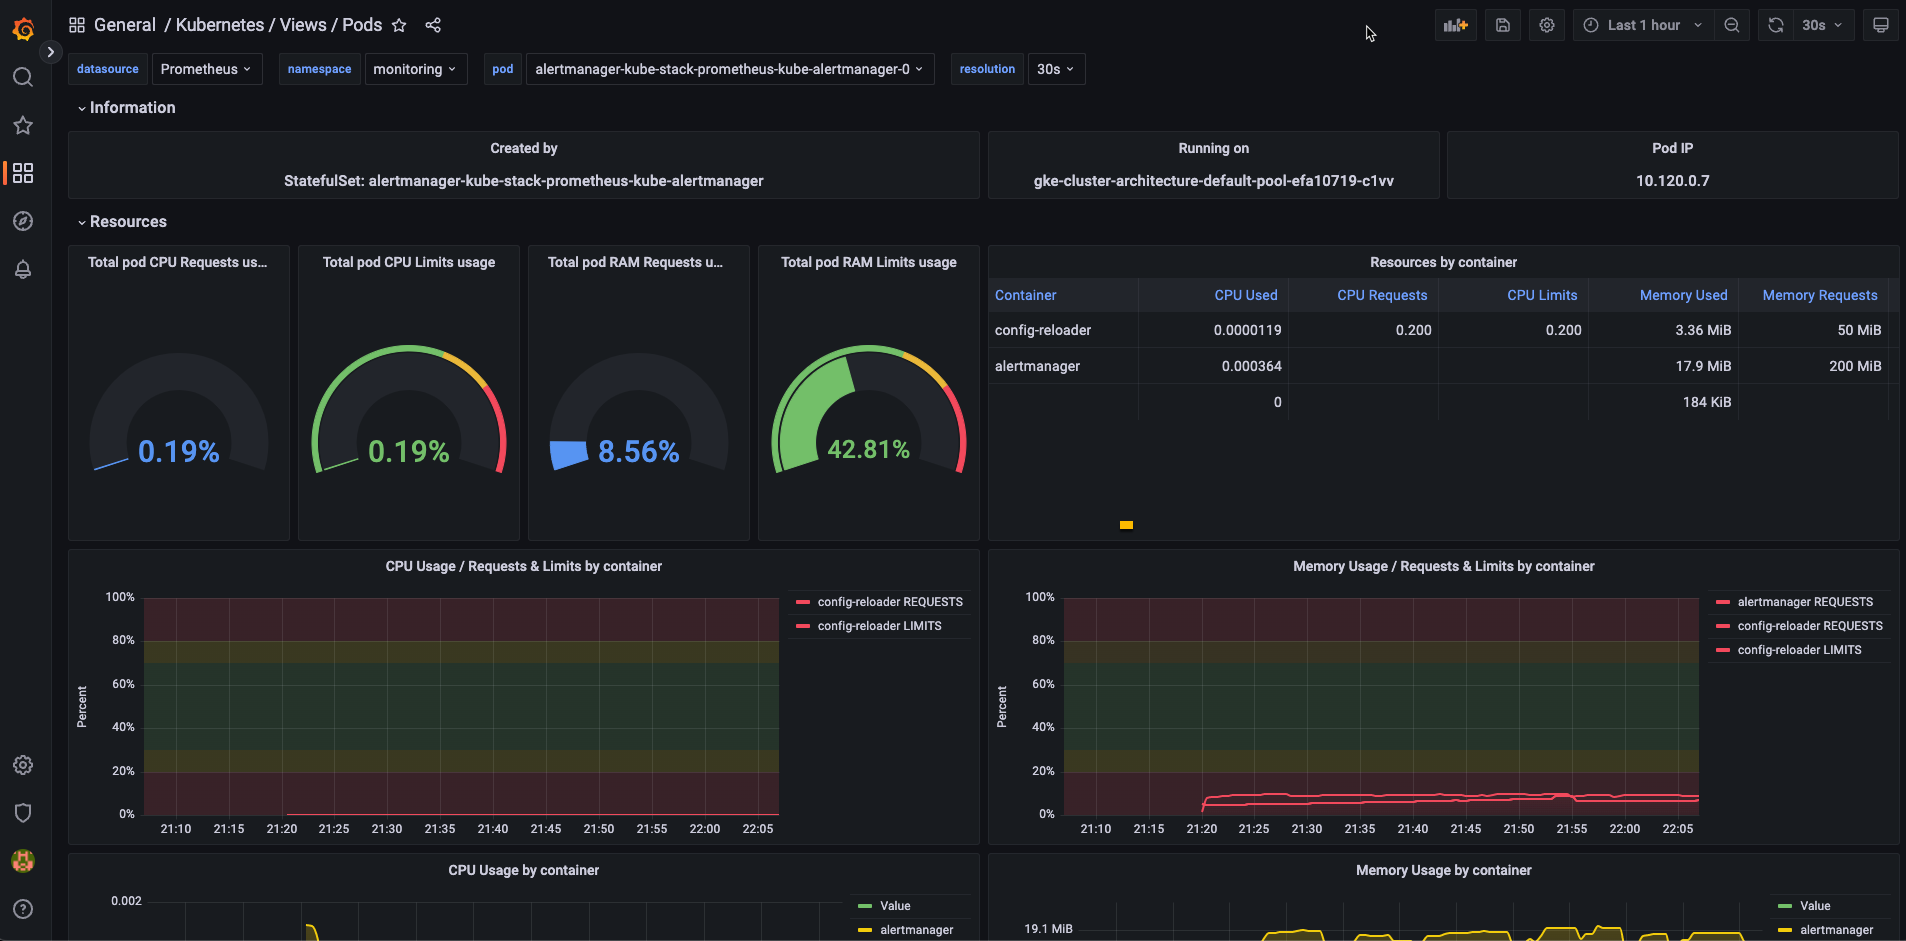
4.在 Grafana 中驗證儀表板:
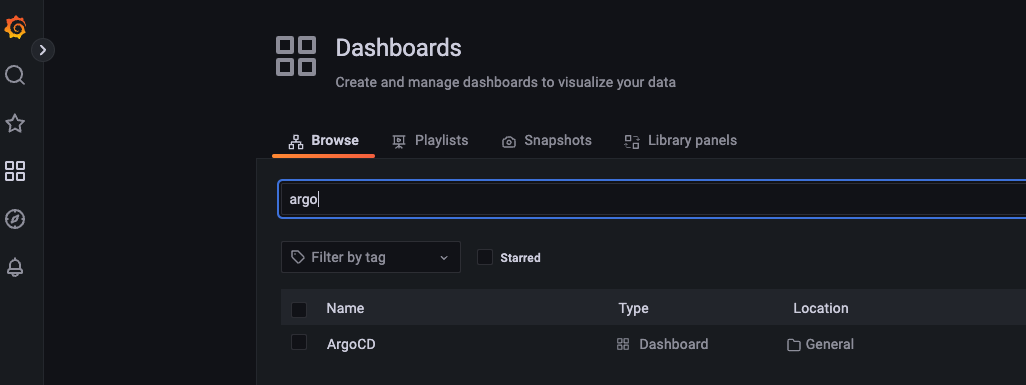
在 Grafana UI 中的左側瀏覽欄中點選 "Dashboards >> Browse", 並在 filter 欄中輸入 "argo":
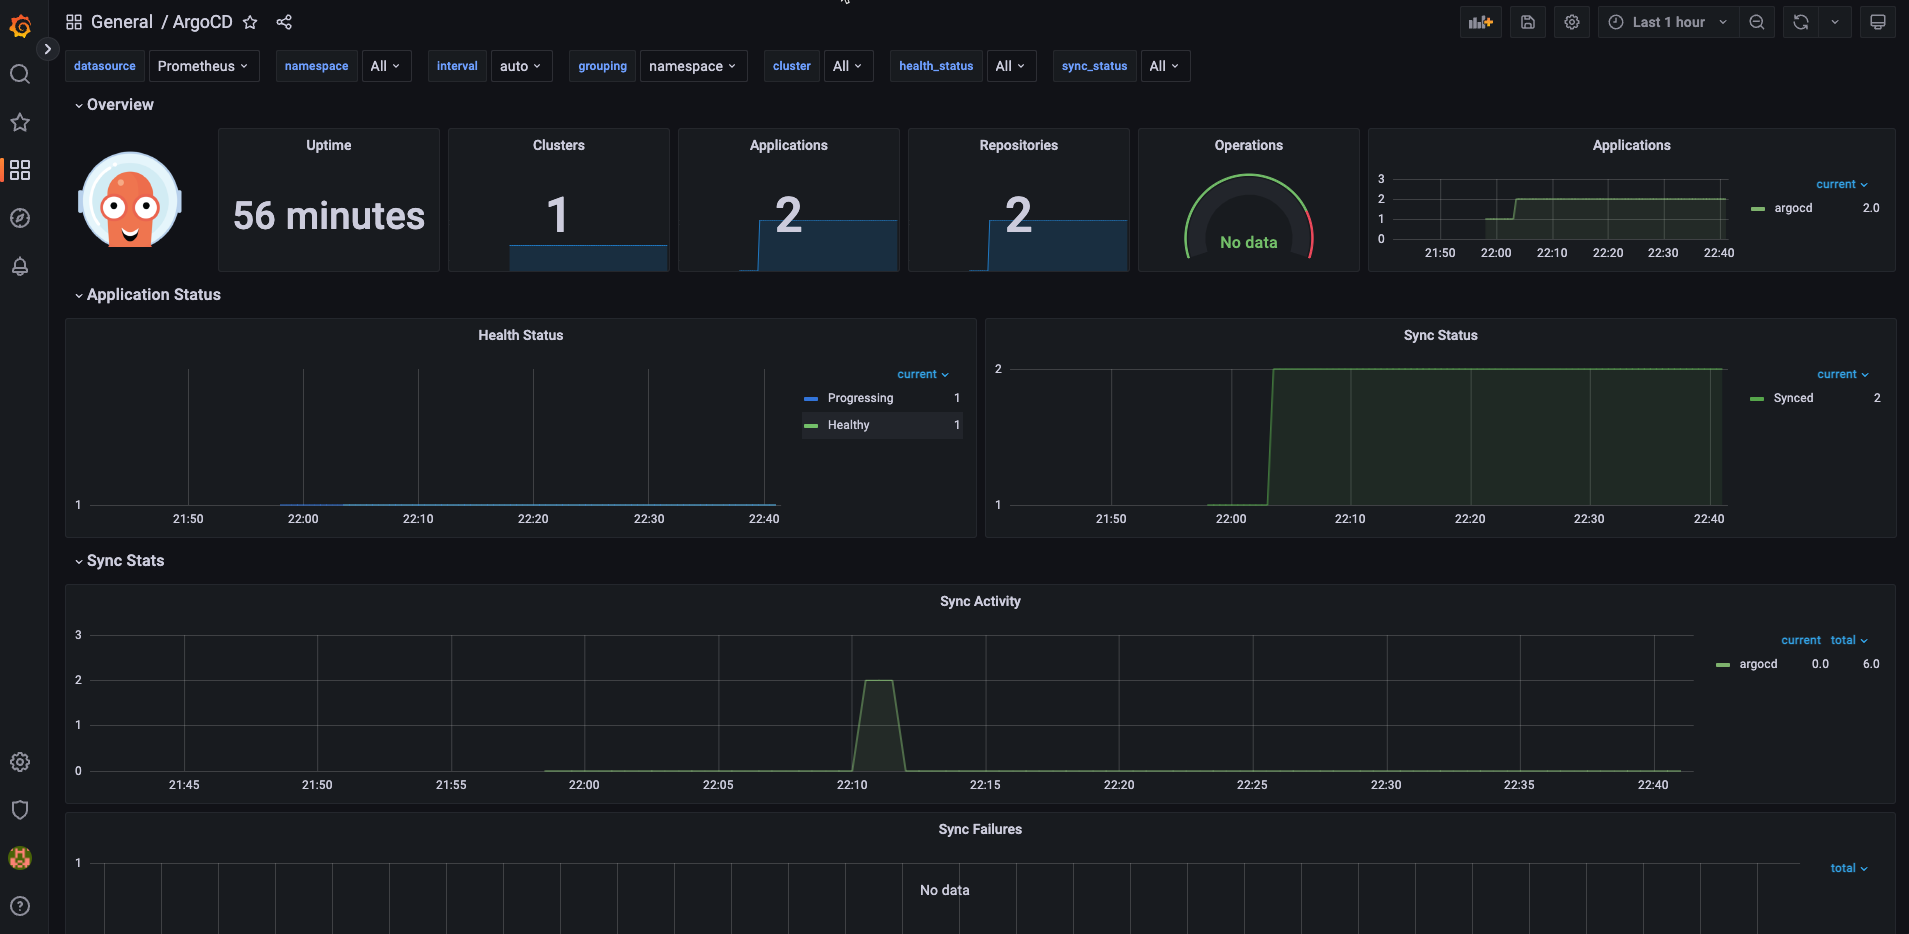
點選 ArgoCD 儀表板:
參考資料:
https://medium.com/@dotdc/a-set-of-modern-grafana-dashboards-for-kubernetes-4b989c72a4b2
https://erhwenkuo.github.io/argocd/operation-manual/metrics/metrics-argocd-integration/#argocd
https://vocus.cc/article/61e60ba9fd897800017098d9
https://github.com/dotdc/grafana-dashboards-kubernetes
https://github.com/grafana/helm-charts/tree/main/charts/grafana
https://argo-cd.readthedocs.io/en/stable/operator-manual/metrics/