內容目錄
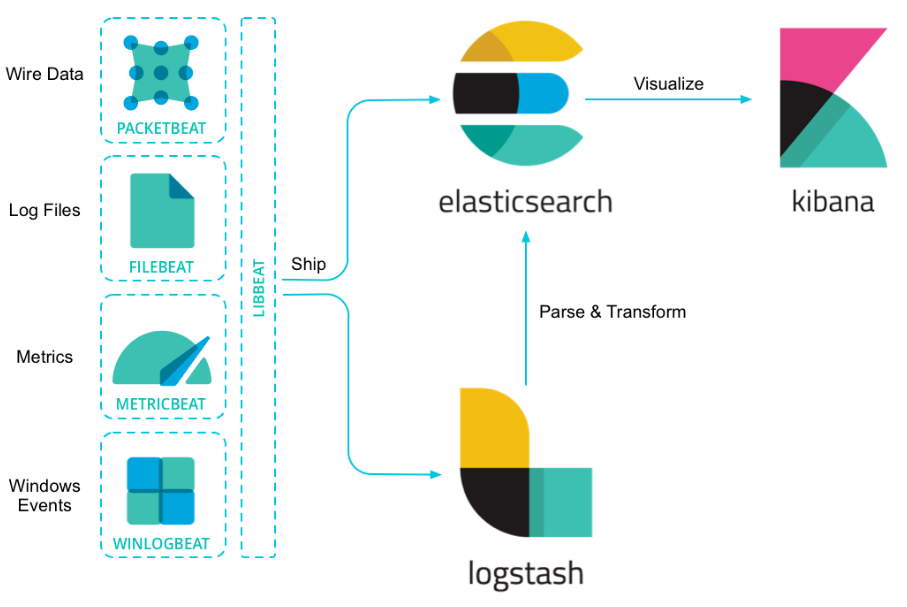
Elasticsearch + Logstash + Kibana(ELK)是一套開源的日誌管理方案
• Logstash:負責日誌的收集,處理和儲存
• Elasticsearch:負責日誌檢索和分析
• Kibana:負責日誌的視覺化
主要收集log的流程 filebeat agent送至logstatch或elasticsearch最後以kibana網頁顯示
安裝JDK (在所有節點上安裝)
yum install -y java-1.8.0-openjdk
配置yum來源
[root@localhost ~]# vi /etc/yum.repos.d/elk.repo
[logstash-7.x]
name=Elastic repository for 7.x packages
baseurl=https://artifacts.elastic.co/packages/7.x/yum
gpgcheck=1
gpgkey=https://artifacts.elastic.co/GPG-KEY-elasticsearch
enabled=1
autorefresh=1
type=rpm-md
安裝ELK (在Master節點安裝即可,測試環境可以不用設定Cluster)
yum install -y logstash elasticsearch kibana
ELK相關配置
這裡設定ES和kibana的主文件進行配置,設定ip和port
#如果啟動單節點,要加入single-node參數
[root@localhost ~]# grep -Ev '^#|^$' /etc/elasticsearch/elasticsearch.yml
path.data: /var/lib/elasticsearch
path.logs: /var/log/elasticsearch
bootstrap.memory_lock: false
network.host: 0.0.0.0
http.port: 9200
discovery.type: single-node
ES需要優化一些系統內核參數
vim /etc/security/limits.conf

# End of file
* soft nofile 60000
* hard nofile 65535
* soft nproc 65535
* hard nproc 65535

-----------------------------------

vim /etc/security/limits.d/20-nproc.conf

* soft nproc 65535
root soft nproc 65535
設定記憶體最高只能設定為系統的50% ex系統8GB 就是設4
vi /etc/elasticsearch/jvm.options

# Xms represents the initial size of total heap space
# Xmx represents the maximum size of total heap space
-Xms4g
-Xmx4g
下指令sysctl -p 生效參數
測試ES是否正常
[root@localhost ~]# curl "http://localhost:9200/_cat/nodes"
172.17.0.1 76 98 39 3.22 3.64 3.94 dilm * localhost.localdomain
配置kibana
[root@localhost ~]# grep -Ev '^#|^$' /etc/kibana/kibana.yml
server.port: 5601
server.host: "192.168.1.45"
server.name: "kibana"
elasticsearch.hosts: ["http://192.168.1.45:9200"]
elasticsearch.preserveHost: true
kibana.index: ".kibana"
i18n.locale: "zh-CN"
kibana中文化參考 https://github.com/anbai-inc/Kibana_Hanization
啟動ES和Kibana
$ systemctl start elasticsearch
$ systemctl enable elasticsearch

$ systemctl start kibana
$ systemctl enable kibana

[root@localhost ~]# netstat -lntup|grep java
tcp6 0 0 :::9200 :::* LISTEN 119229/java
tcp6 0 0 :::9300 :::* LISTEN 119229/java
安裝Filebeat
yum -y install filebeat
部署Filebeat 設定 這邊範例有兩台機器
server1
[root@localhost ~]# grep -Ev '^#|^$' /etc/filebeat/filebeat.yml
filebeat.inputs:
- input_type: log
  paths:
    - /var/log/*
output.logstash:
  hosts: ["192.168.1.45:5044"]
  index: "first-index-%{+YYYY.MM.dd}"
server2
[root@grafana filebeat]# grep -Ev '^#|^$' /etc/filebeat/filebeat.yml
filebeat.inputs:
- input_type: log
  enabled: true
  paths:
    - /data/wwwlogs/*
  encoding: "utf-8"
  #encoding: GB2312
output.logstash:
  hosts: ["192.168.1.45:5045"]
  index: "web-log-%{+YYYY.MM.dd}"
啟動filebeat
$ systemctl start filebeat
$ systemctl enable filebeat
設定logstatch
# Sample Logstash configuration for creating a simple
# # Beats -> Logstash -> Elasticsearch pipeline.

input {
   #tcp
   beats
   {
     port => 5044
     tags => "k8s"
     #codec => json { charset => "UTF-8" }
     #add_field => {"type"=>"filebeat"}
     #codec => json_lines
    }

}

output {
    if "k8s" in [tags] {
    elasticsearch {
        hosts => ["http://192.168.1.45:9200"]
        index => "first-index-%{+YYYY.MM.dd}"
        #user => "elastic"
        #password => "changeme"
      }
 }
 stdout { codec => rubydebug}
}

input {
   #tcp
   beats
    {
     port => 5045
     tags => "weblogs"
     #add_field => {"type"=>"filebeat"}
     #codec => json { charset => "UTF-8" }
     #codec => json_lines
    }

}

output {
    if "weblogs" in [tags] {
    elasticsearch {
        hosts => ["http://192.168.1.45:9200"]
        index => "web-log-%{+YYYY.MM.dd}"
        #user => "elastic"
        #password => "changeme"
      }
 }
 stdout { codec => rubydebug}
}
以下兩種方式擇一啟動logstatch
服務方式
$ systemctl start logstash
$ systemctl enable logstash
以設定檔方式手動指定設定檔啟動
nohup /usr/share/logstash/bin/logstash -f /etc/logstash/logstash.yml &
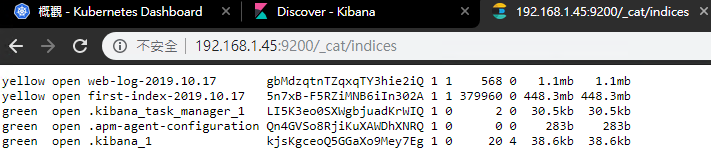
測試ES服務
以瀏覽器開啟http://192.168.1.45:9200/_cat/indices
正常會出現兩台server的資料
8.設定ES索引
輸入xxx-log-* 然後下一步加入索引
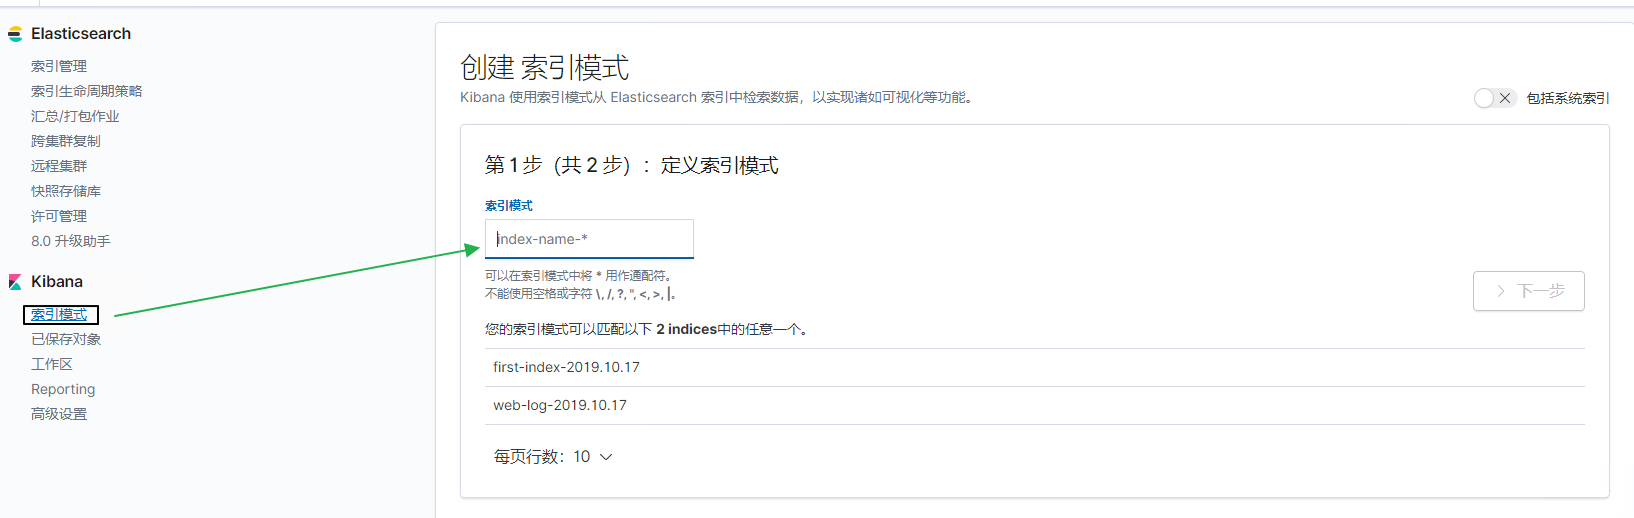
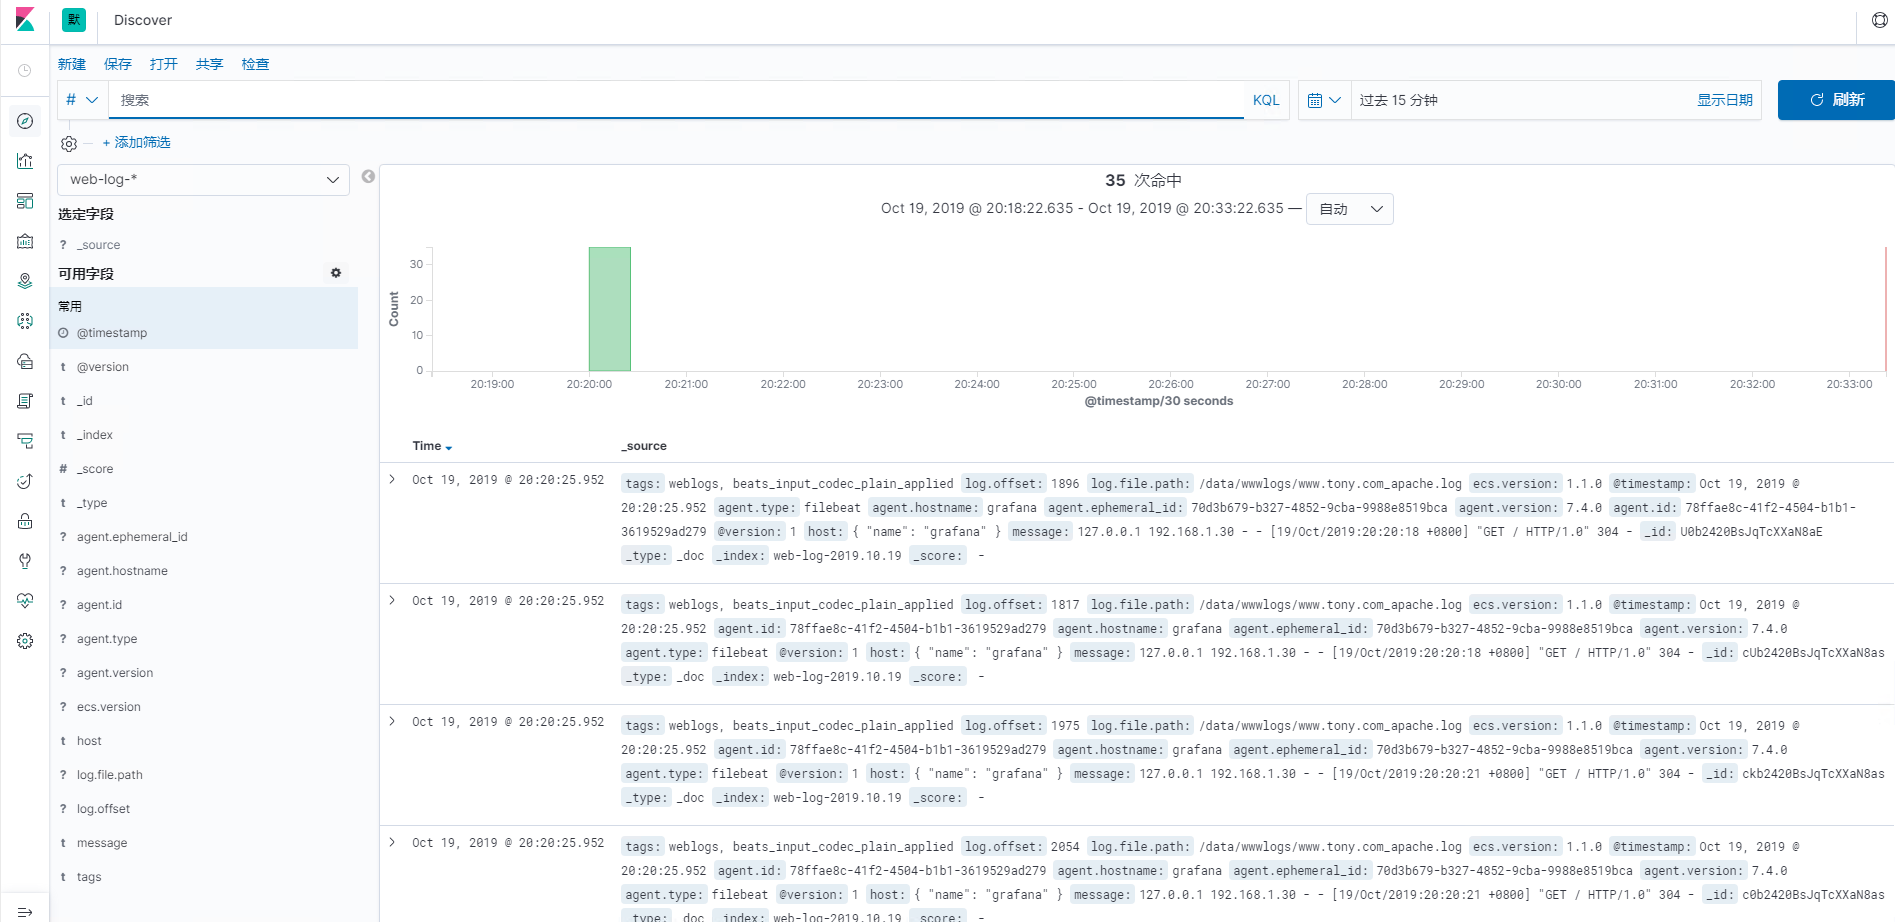
在Discover頁面會出現已加入的索引
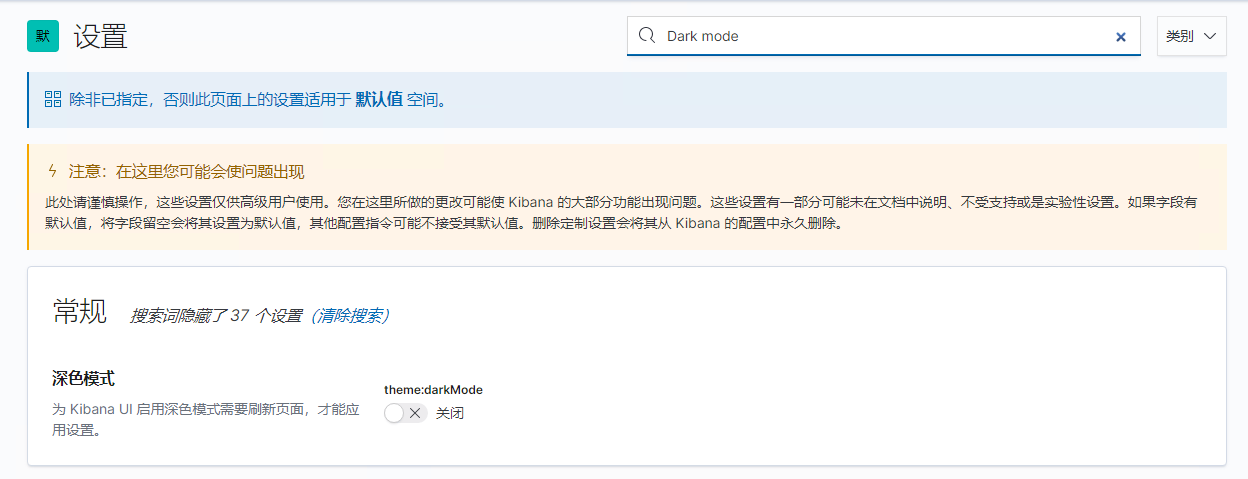
kibana的Drak mode深色模式